
The Federal Reserve recently raised the fed funds rate a quarter of a point on December 14. This was for only the second time since the Great Recession back some six years ago. They finally feel that they have hit their dual mandate targets of full employment below 6% and anticipated inflation of 2%. As such, they are beginning down the path away from ZIRP (zero interest rate policy) to normalization of interest rates. Along those lines, they are now anticipating three more rate rises in 2017. Of course their actual response will be data dependent. If the economy booms, they could raise rates six times. But let’s just stick with the three potential rate rises and examine what it means and how should we react?
Most investors know that bond prices and bond yields move inversely to each other. This is a see-saw type relationship. A simple example will show this, ignoring duration and credit quality. Let’s say we have an old bond priced at $100 and a coupon of 1%. We would earn $1 for the year. Let’s say that interest rates rise to 2% over the year. A new $100 bond with a coupon of 2% would pay $2 for the year. What price does the old bond have to fall to in order for it to be competitive with the new higher yield? In this simple example with all other things being equal, the price would drop to $50. A 1% coupon on a $50 old bond price would yield us the equivalent of $2 on the new bond for the year.
This principle of higher yields and lower prices is shown on the chart. The blue line shows the current prices of newly issued bonds after the quarter point rate rise. If we get three more quarter point rate rises in 2017, where would prices fall to on those bonds?
To be sure, we understand that the bond’s duration has declined by one year and that would impact prices. We are ignoring quality questions. For example for bonds maturing in less than 1 year would not be impacted much, but we are just trying to show the see-saw principle in action. A $100 bond at 1% yields us $1. At what price would that bond fall to when comparable new bonds a year from now are yielding 1.75%? That is the current yield plus the three quarter point rate rises. The chart below will provide some guidance on this.
Again though, I want to emphasize that this chart ignores any credit quality and duration questions.
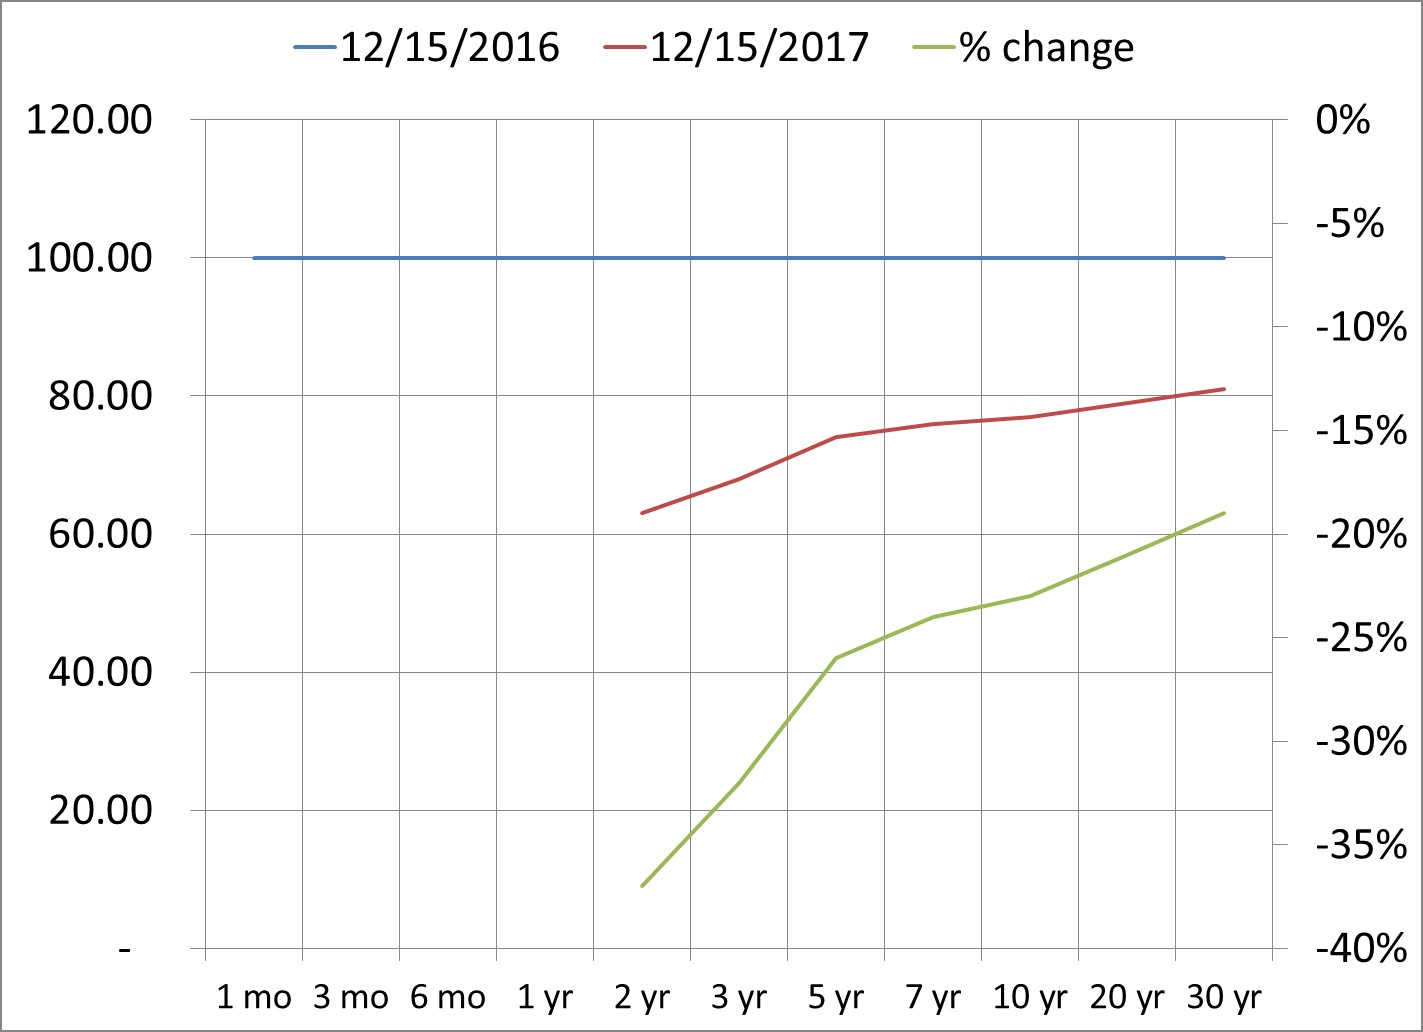
The blue line shows the price of the current bonds at 12/15/16 with the left scale. Basically I have them all priced at par or $100 per bond. The red line shows the comparable price a year from now with the same left scale. Comparable means the price the old bond has to fall to in order to be competitive with new bonds at par that yield three quarters point more. The green line shows the percentage loss with the right scale.
Shorter term duration bonds will not be impacted as much as this implies because they will soon mature at par. As an example, the current two-year bond will drop in price over the next year to remain competitive with higher yielding new bond issues. But it will mature at par a year later, even though it suffered a price decline before then.
This brings us to the question of how we might react to this very real potential of three quarter point rate rises in 2017. Most bond prices with a maturity beyond 10 years will fall roughly 20%. A five year bond will take an initial hit in price, but again, will mature back at par upon maturity, assuming no credit risk, over the subsequent four years. The problem with doing nothing though is missing out on higher yields in the meantime.
So, we have two suggestions. The first is that investors should consider shortening the duration of their bond portfolios. Focus on the maturities out to one year. The second is that investors should consider selling bond funds and using individual bonds. The first suggestion is a fairly well-known tactic in a rising rate environment. The second may not be as intuitive. So, let’s look at this.
A bond fund is made up of potentially hundreds if not thousands of holdings. Each bond has a different maturity date, but the point is, the bond fund itself does not have a maturity date. In a rising rate environment, a bond fund is never assured of returning to the price at which you bought it. An individual bond, however, may drop in price after you bought it because of the rate rise, but it will eventually mature at its par value, again assuming no credit default. A bond fund has no par value.
So a short term bond fund like BSV (Vanguard Short-Term Bond Index Fund ETF) that has a current yield of 1.5% will be buying and selling bonds over the next year, but by December 2017 it could be yielding 2.25% (up that three quarter point rate rises). Its price is bound to drop to reflect this new reality.
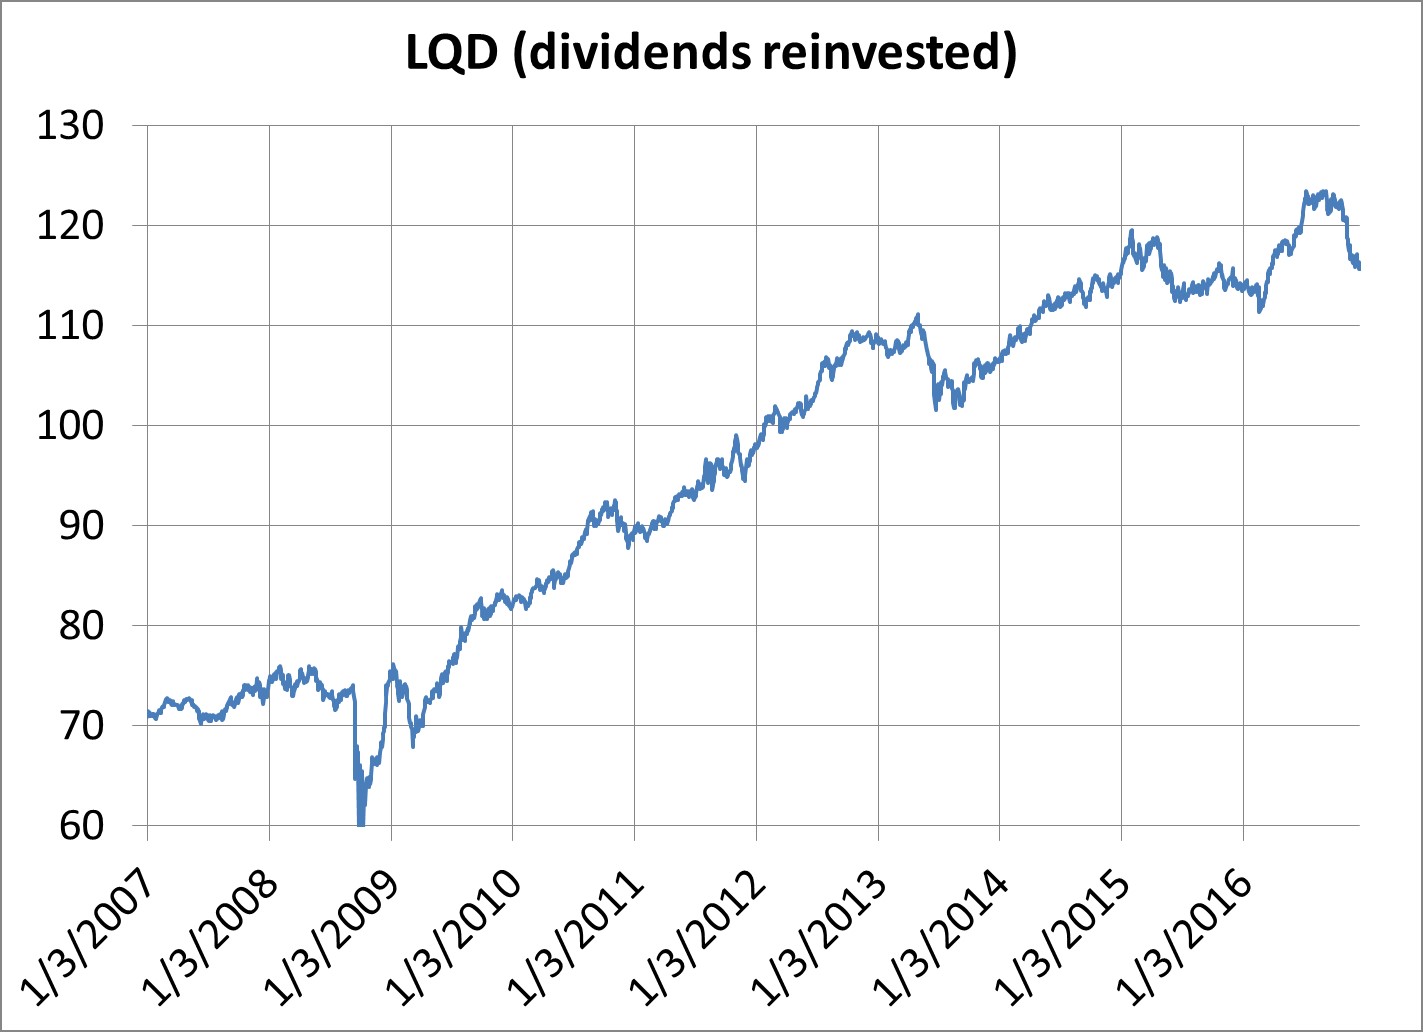
Or consider LQD (iShares iBoxx Investment Grade Corporate Bond ETF) that yields 3.4%. If the Fed raises rates 75 basis points, this implies LQD will be yielding around 4.2% next year. Take a look at this next price chart of LQD with dividends reinvested. A higher yield implies a lower price, perhaps down to around 95 from about 115.
To be sure, moving from a professionally managed, diversified bond fund to buying individual bonds may be a large step for many. The alternative is to simply shorten duration by buying ultra-short term bond funds like SIGVX (Ridgeworth Funds US Govt Sec Ultra-Short Bond) or BUBSX (Baird Funds Ultra Short Bond). And of course there are always simple money market funds to consider.
The Federal Reserve has been the friend of stock and bond investors for some eight years now. We know the old saying, don’t fight the Fed. When they are easing, it is traditionally good for stocks and bonds. When they are tightening, it is traditionally bad for stocks and bonds. At least right now, we know their intention is to tighten. There is no reason the danger sign should be ignored. We suggest shortening bond durations and avoiding bond funds for individual bonds.