
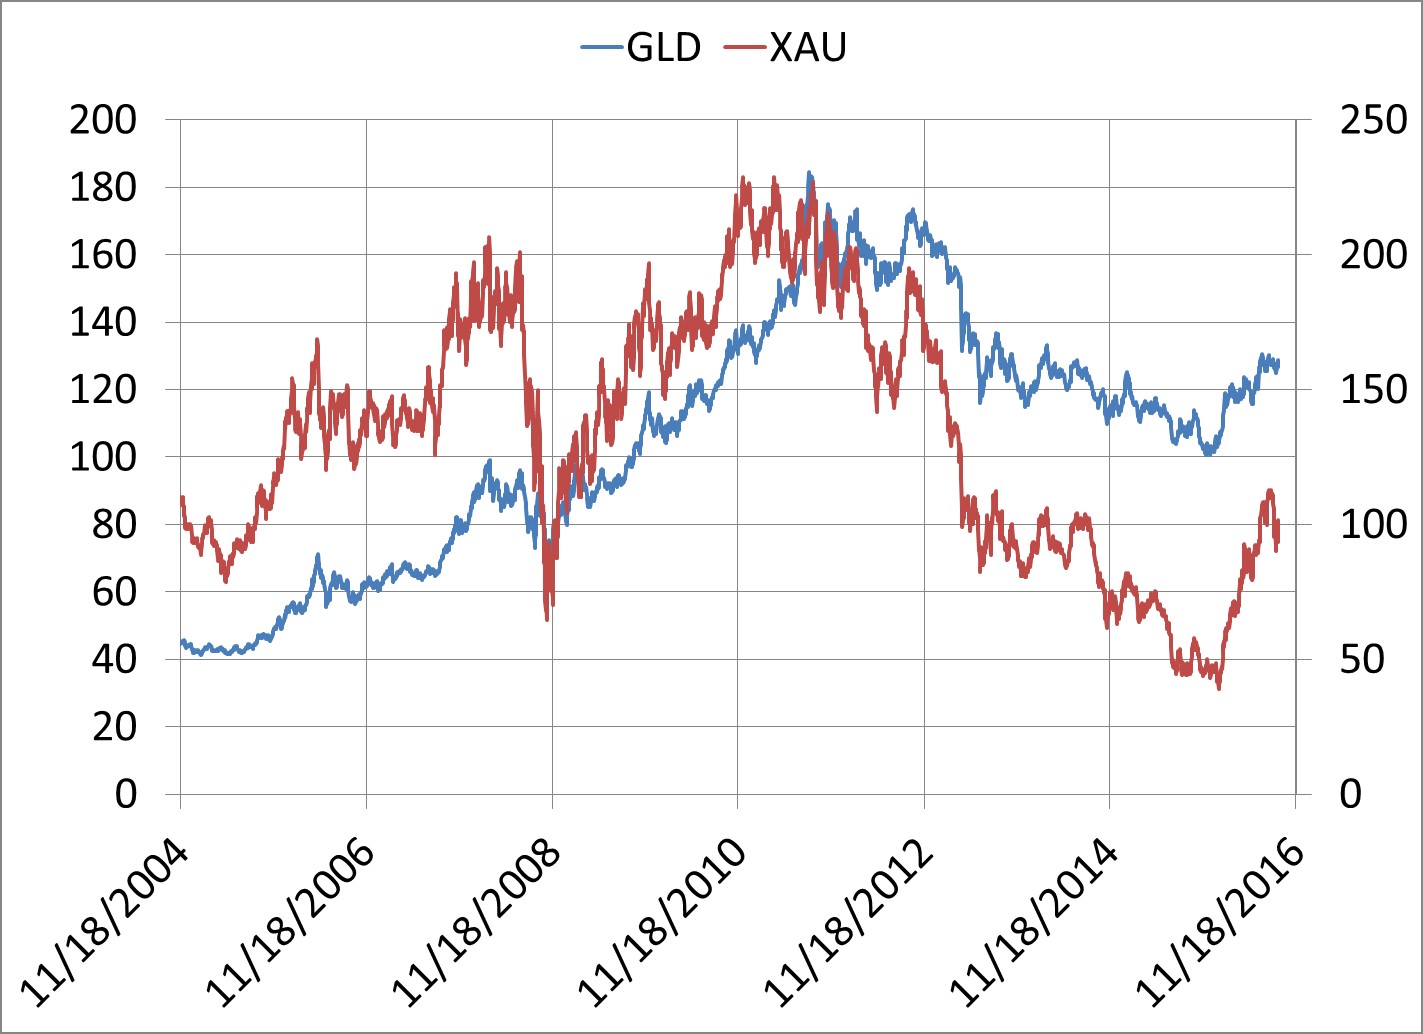
Along with the gold price itself, precious metal stocks have risen substantially over the last year. One proxy of gold and silver is the PHLX (Philadelphia) Gold Silver Index known as XAU (INDEXNASDAQ: XAU). This is a capitalization weighted index of 30 companies in the gold and silver mining industry. To measure the price of gold, we use the ETF GLD. GLD is SPDR Gold Shares ETF (NYSEARCA: GLD).
The first chart shows the actual prices of GLD (blue line, left scale) and XAU (red line, right scale) from 11/8/2014 to the present.
What is perhaps more interesting and revealing is to compare the price of GLD itself against this XAU index. This second chart shown next is GLD (blue line, left scale) and XAU (red line, left scale) and the Ratio between them (green line, right scale). GLD and XAU were set to 100 at 11/18/2004. The Ratio was set to 1.
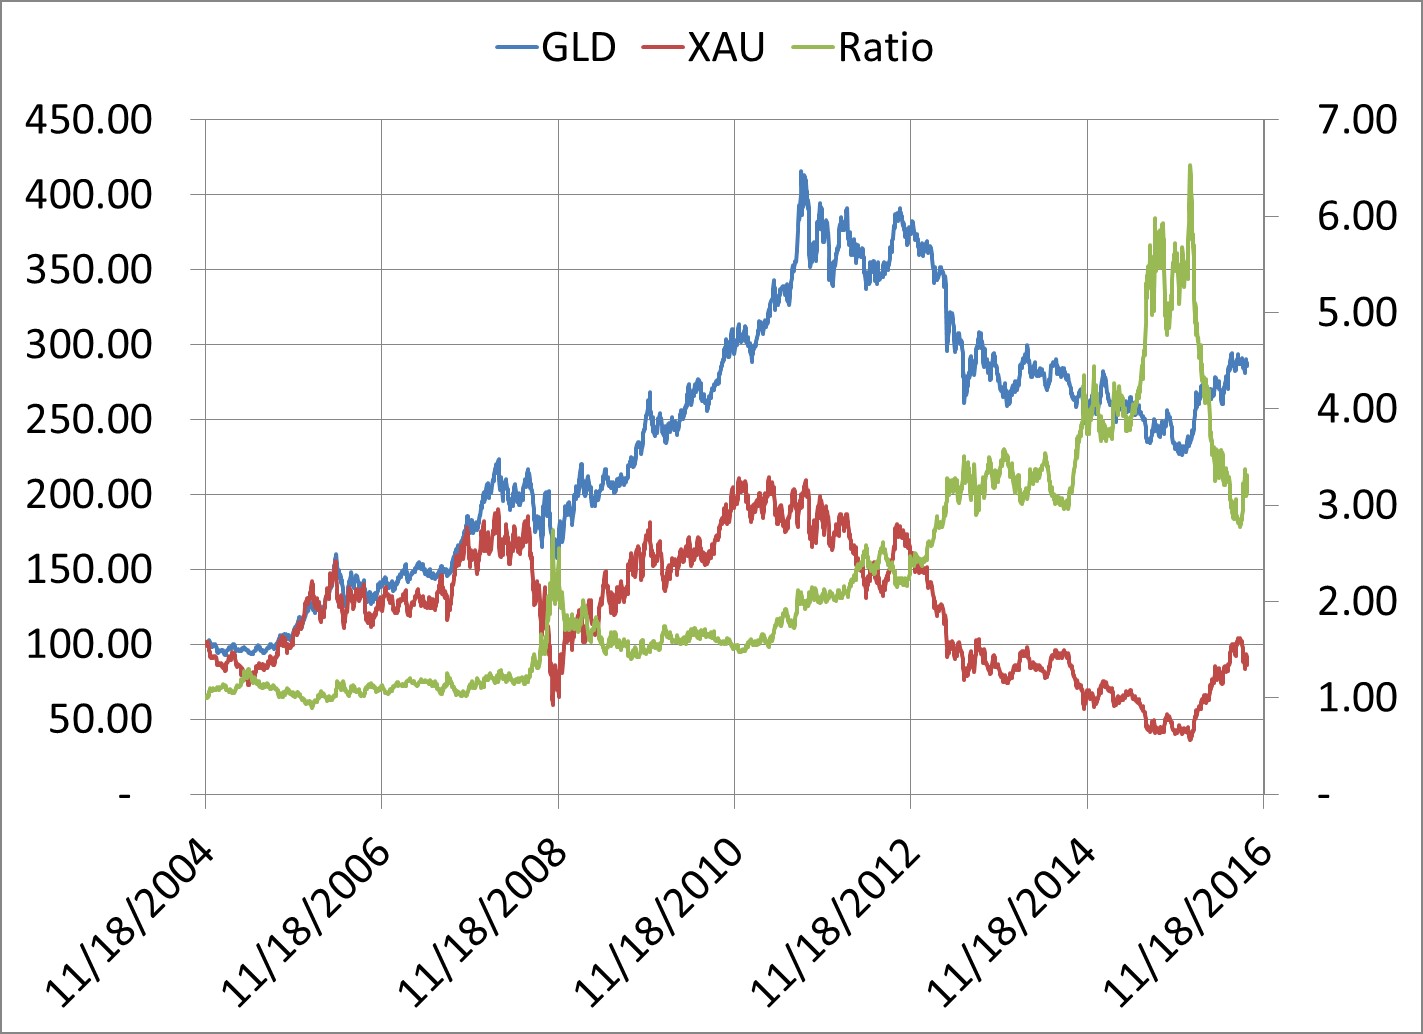
As you can see when GLD was dropping to its eventual bottom last year in December 2015 and XAU was also dropping, the Ratio between the two series was soaring. This suggested that gold mining stocks were undervalued relative to the price of the precious metals they were mining.
Of course, there are other factors to consider regarding individual companies such as debt and management, but generally speaking, gold mining stocks were the cheapest they had been since the Ratio began in 2004.
Since those lows last year, GLD and XAU have both rallied. The Ratio declined as XAU rallied more strongly. This reflected in part the leverage of precious metals miners.
So, what does the Ratio suggest now? It has fallen back into territory it was last at in 2013 to 2014. It is not at an extreme reading currently that might make a forecast easier, but it nonetheless suggests XAU is relatively cheaper than GLD. If we examine the ratio’s history to see more information, there was one other clear spike; it was in November 2008. Subsequently, GLD and XAU both rallied and the Ratio fell back. Both series continued to rally to their previous peaks in September 2011.
There were a few minor spikes higher like in May 2012 and June 2013 and December 2014. Subsequent to those spikes, the Ratio fell back and then trended higher with XAU falling the most. XAU and GLD both declined in price to their final lows in December 2015.
In effect, the past action doesn’t give us too much to go on currently; there were times after Ratio spikes when they both rallied and times when they both declined.
As mentioned, XAU has rallied strongly with the price of GLD over the last year, but it would need to double again to return to its former glory days. What’s interesting is gold’s rally over the last year has taken place in a low inflation, low interest rate, and relatively low financial stress background. Typically, we would see gold rally with high stress and high inflation, as some sort of hedge. During the Federal Reserve’s (Fed) quantitative easing programs for example, this was the back ground to their rallies into September 2011.
Since then the Fed has slowly tried to “normalize” its monetary policy by removing quantitative easing and now in a second step by starting to slowly lift interest rates. If the Fed finally raises interest rates a couple more times over the next six months, how might this impact XAU and GLD?
The negative assumption is the cost of holding gold goes up. The perception is thus gold may decline in price. But the offset to this is that normalizing would take place if inflation rises; that is what the Fed ostensibly has been waiting for the past year. As measured by the core Consumer Price Index (CPI ex food and energy), it is rising at 2.3% annually. That perhaps is one message of the recent gold rally; that inflation, however, unapparent currently, may be on the return. If so, gold may return as a hedge against inflation.