
As every investor knows by now, the Federal Reserve raised the fed funds rate by a quarter-point on March 15th. More importantly it reiterated its intent to increase rates another three times and maybe even four times in 2017. By year end, we should see at least 1.652%. The question on every one’s mind is how this might impact stocks.
Unfortunately, there is no simple one-size-fits-all answer. Historically, correlations between rates and stocks vary from negative to positive. There were times when rising rates negatively impacted stocks, but there were other times when rising rates correlated with rising stocks. On the flip side, there were times when declining interest rates helped stocks rally, but there were other times when falling interest rates coincided with a falling stock market.
The following chart will show this varying relationship and the table provide the details. I will then explore the implications.
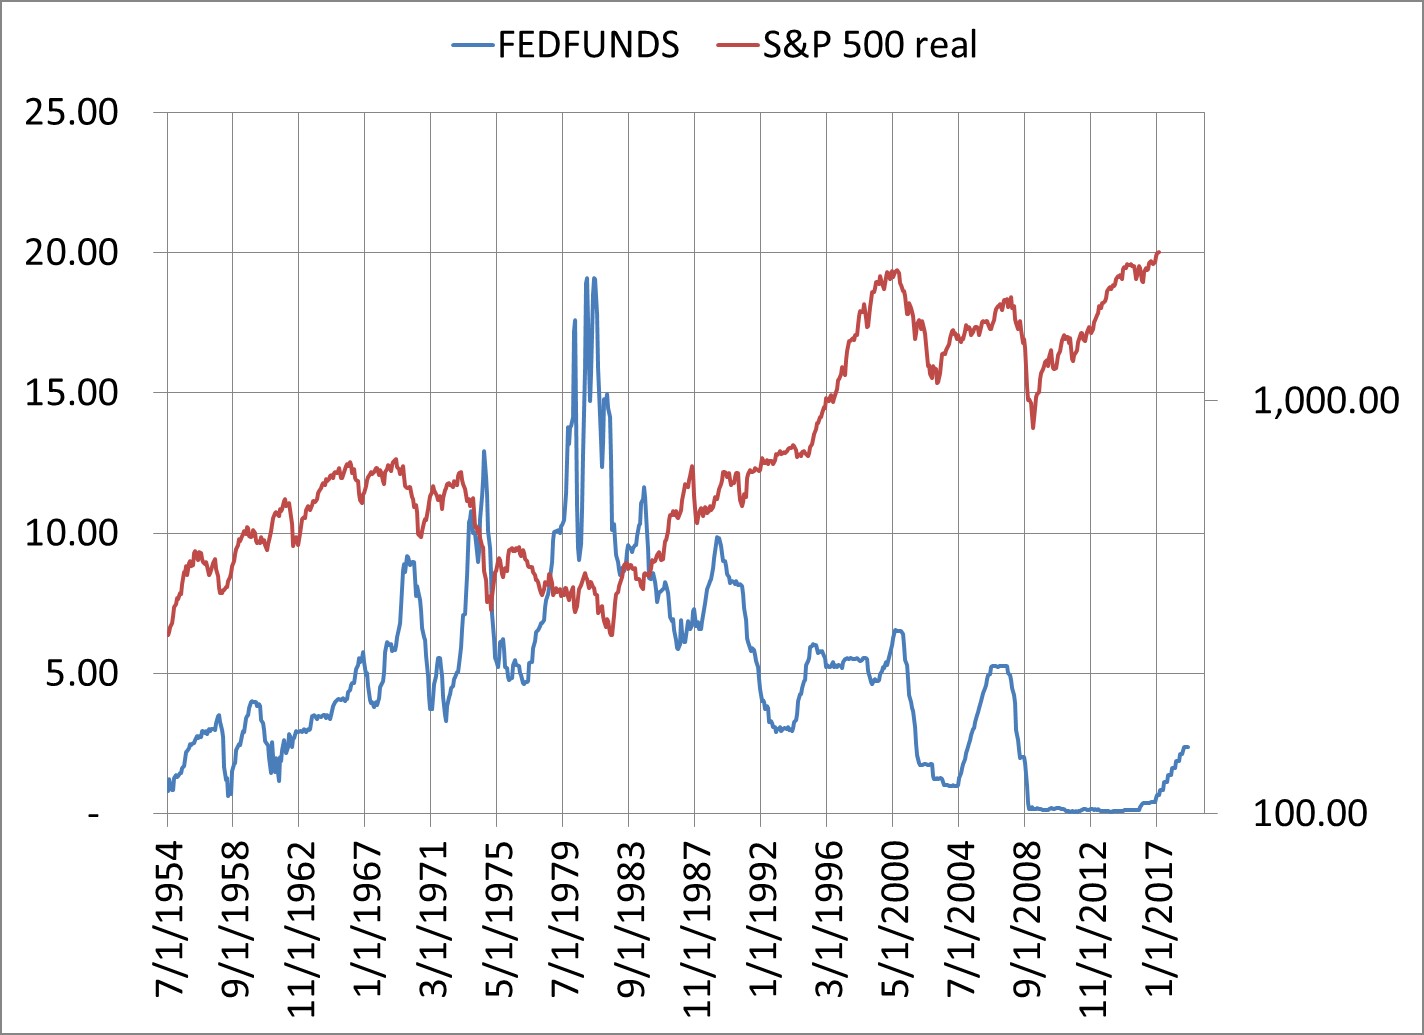
This chart shows the fed funds rate from 7/1/1954 through the present and into the projection to 2.375% out to December 2018; it is the blue line on the left scale. It also shows the S&P 500 real price (adjusted for inflation) on the red line with the right logarithmic scale starting from 7/1/1954 through February 2017.
As the reader can eyeball on the chart and as I’ll show in the table next, it is apparent that there really is no clear cut perfectly inverse correlation between short-term interest rates and stocks. To be sure, this was plotted in hindsight, but there is no absolute conclusion to be drawn. Many investors, however, believe there is an inverse relationship between the two series. The two assumptions are that rising rates are a negative for stocks and that falling rates are a positive for stocks. While this is true sometimes, it is not always the case. This next table shows the correlations between the two series over various time periods. A positive correlation means they generally moved in the same direction. A negative correlation means they generally moved in opposite directions over the defined period.
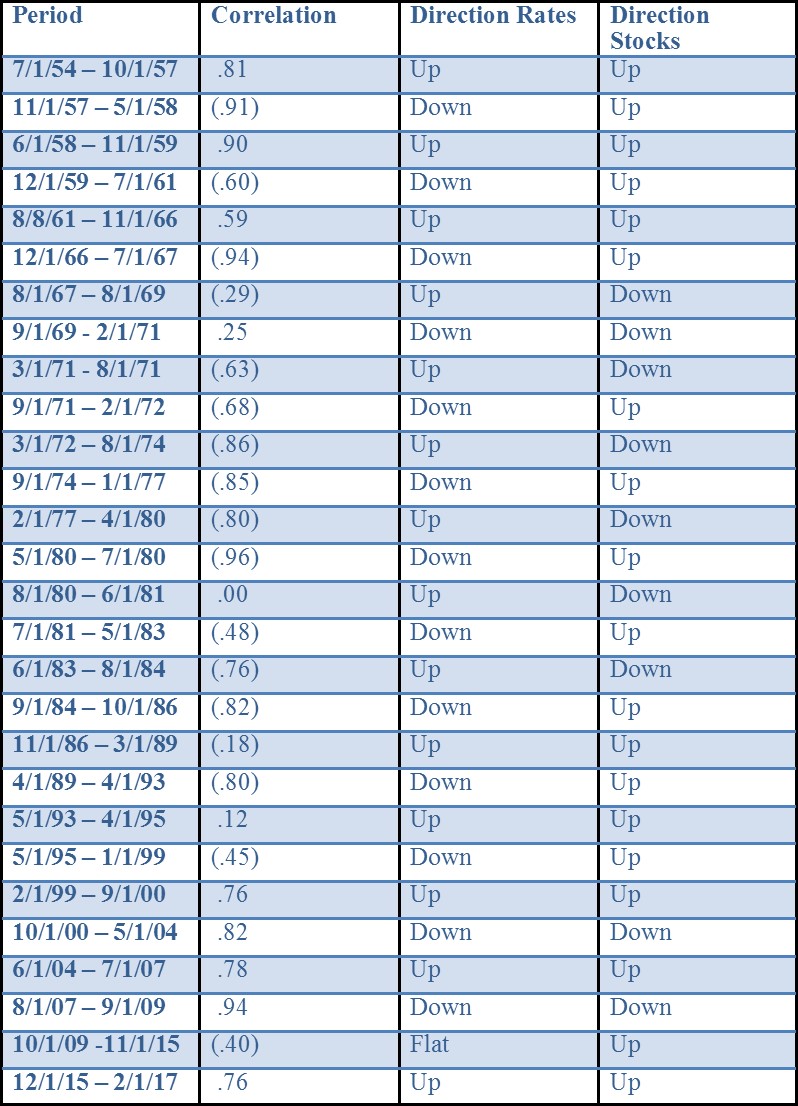
So, even though there is no absolute perfect correlation between the two series, can we draw some general conclusions anyway? There were 28 periods measured when rates rose or fell, what was shown?
There were 18 periods (excluding the flat) of negative correlations where the two series moved in opposite directions. This is what most investors expect.
There were, however, 10 periods of positive correlations. In seven of those times, rising rates correlated positively with rising stocks. In the other three instances, falling rates correlated positively with falling stocks.
The lesson here may be that rising interest rates may reflect a strong economy. The strong economy is what helps stocks move higher. At some time, there may be an inflection point where the business cycle still rules. This is when rising rates eventually slow the economy into recession and then stocks and rates will also decline.
Another point is that the positive correlations cluster from 1999 through the present. Rising rates did not reflect a weak economy, but a strong economy. Stocks benefited. When the Federal Reserve was cutting interest rates, it reflected a weak economy. Stocks fell during those periods.
What to do now?
If we use the past decade as the template for current trends, then today’s rising rates may reflect the stronger economy. Rather than be a negative, rising rates are signaling positive economic trends. Indeed, the Conference Board’s Leading Economic Indicators Index is hitting new highs. Unemployment is below 5%. GDP is plus 2%. Some believe the Federal Reserve is already behind the inflation curve and will have to play catch up in the years ahead. This may eventually lead to that inverse correlation, but right now, if the recent past is a guide, rising rates may coincide with a rising stock market.
And that really is the point; it will be the unexpected that will be important to watch for in the months ahead. For example, the Fed has signaled three to four rate increases of a quarter-point each for 2017. If the Fed starts talking about five or six raises or if they raise rates by a half-point or more, then that unexpected news may lead to a market top.
In the meantime, what should bond and stock investors do?
Based on what is already signaled, bond investors should be in the process of shortening portfolio durations by looking at short to intermediate term bond funds and ETFs. Consider BSV (Vanguard Short-Term Bond Index, current yield 1.5%) or CSJ (iShares 1-3 Year Credit Bond ETF, current yield 1.5%). In addition, high-yield funds are in a sweet spot with the stronger economy potentially helping their operations. Consider SJNK (SPDR Short-Term High Yield Bond ETF, current yield 5.7%).
Suggestions for stock investors are more difficult. Stocks may go higher with higher rates. That has been the recent trends. But risk is already high. The S&P 500 PE ratio is at 26.5x trailing 12-month reported earnings. PE ratios above 22 are associated with tops, rather than bottoms. As long as the trend is up, however, and unexpected news does not surface, investors may still consider the large cap markets like QQQ (PowerShares QQQ, the 100 largest domestic and international nonfinancial companies listed on NASDAQ) and SPY (StateStreet SPDR 500 Trust, 500 largest domestic companies).